1 Rhetorical Patterns Across Academic Levels
1.1 Use Case
A writing studies researcher wants to investigate how rhetorical patterns evolve as students progress through their academic careers. Specifically: Do advanced graduate writers use language differently from final-year undergraduates? And where along the educational trajectory do shifts in academic discourse emerge?
This vignette walks through a complete end-to-end analysis using the MICUSP-by-level corpus (G_MICUSP_by_level), which partitions the Michigan Corpus of Upper-Level Student Papers (MICUSP) into four academic-level categories:
| Code | Category | Documents |
|---|---|---|
| G0 | Final Year Undergraduate | 432 |
| G1 | First Year Graduate | 202 |
| G2 | Second Year Graduate | 117 |
| G3 | Third Year Graduate | 77 |
MICUSP contains upper-division papers from 16 academic disciplines, collected at the University of Michigan. See the MICUSP dataset page for details.
1.2 Step 1: Load the Corpus
Navigate to the Manage Corpus Data page. Under the Internal tab, you will find pre-processed corpora available for immediate analysis. Select the Large Dictionary model from the model dropdown, then choose G_MICUSP_by_level from the corpus list. Click Process Target.
The Internal corpora are pre-tagged and stored on the server. There is no need to upload or process raw text files. The Large Dictionary model provides the most comprehensive DocuScope tagset.
After loading, the corpus summary will confirm:
- Total documents: 828
- POS tokens: 2,114,269
- DocuScope tokens: 1,693,754
1.3 Step 2: Process Document Metadata
Return to Manage Corpus Data. In the sidebar, under Target corpus metadata, select Yes for Do you have categories in your file names to process? Then click Process Document Metadata. The four academic-level categories (G0–G3) are encoded in the document filenames, and this step extracts those groupings automatically.
In this workflow, metadata means document-level labels extracted from the filenames, not additional linguistic annotation. For G_MICUSP_by_level, the filename prefix identifies the writer’s academic level (G0, G1, G2, or G3).
Processing metadata makes those labels available as grouping variables throughout the app. That is what enables later steps such as comparing G3 against G0 in Compare Corpus Parts, highlighting levels in PCA, and generating grouped boxplots.
After processing, the category counts will confirm:
- G0 (Final Year Undergraduate): n = 432
- G1 (First Year Graduate): n = 202
- G2 (Second Year Graduate): n = 117
- G3 (Third Year Graduate): n = 77
These categories will now be available as grouping variables throughout the app.
1.4 Step 3: Explore Tag Frequencies
Navigate to the Tag Frequencies page. Select the DocuScope tagset and click Tags Table. The resulting table shows relative frequencies (RF) — the percentage of all DocuScope-tagged tokens that belong to each tag category.
The top tags across the full corpus reveal a writing context that blends academic terminology, narrative or descriptive content, and information structures:
| Tag | RF (%) | AF |
|---|---|---|
| AcademicTerms | 8.90 | 150,665 |
| Character | 7.65 | 129,571 |
| Narrative | 6.21 | 105,176 |
| Description | 5.81 | 98,467 |
| InformationExposition | 4.79 | 81,210 |
| Negative | 3.77 | 63,913 |
| InformationTopics | 3.52 | 59,553 |
| Positive | 2.91 | 49,306 |
| MetadiscourseCohesive | 2.33 | 39,431 |
| Reasoning | 2.10 | 35,562 |
AcademicTerms is the dominant tag at nearly 9% of all DocuScope-tagged tokens, reflecting the technical vocabulary expected in upper-division academic writing. The high frequency of Character, Narrative, and Description reflects the diversity of disciplines included in MICUSP — from literary analysis and history (which use narrative description) to STEM fields (which use precise description of procedures and results).
The Tag Frequencies page also provides a bar chart view that makes it easy to compare the relative prominence of different rhetorical categories at a glance. Use the Tagset selector in the sidebar to toggle between Parts-of-Speech and DocuScope views.
1.5 Step 4: Compare Corpus Parts
Navigate to the Compare Corpus Parts page. This tool performs a keyness analysis comparing the rhetorical profile of one part of the corpus against another.
Use Compare Corpora when you want to compare two separately loaded corpora, such as a target corpus and a reference corpus. Use Compare Corpus Parts when you want to compare groups within a single corpus after extracting categories from the filenames as metadata.
In this workflow, you are not loading a second corpus. Instead, you are comparing academic levels inside G_MICUSP_by_level, so Compare Corpus Parts is the appropriate tool.
Select the target and reference groups:
- Under Target corpus categories, click G3 (Third Year Graduate)
- Under Reference corpus categories, click G0 (Final Year Undergraduate)
- The status indicator will confirm: Ready to compare 1 target vs 1 reference categories.
Click “Keyness Table of Corpus Parts” to generate the analysis.
The corpus information panels confirm the comparison:
- Target (G3): 77 documents, 267,624 POS tokens, 214,885 DocuScope tokens
- Reference (G0): 432 documents, 910,616 POS tokens, 724,400 DS tokens
In the sidebar, switch to Tags Only and choose the DocuScope tagset to view tag-level keyness statistics. The table reports log-likelihood (LL) as the significance measure and log ratio (LR) as effect size:
- Tokens highlights specific words or token-tag combinations that distinguish one group from another.
- Tags Only collapses the results to broader rhetorical or grammatical categories.
Because this workflow asks how rhetorical patterns vary across academic levels, Tags Only is the more interpretable view.
1.6 Keyness (LL) or Effect Size (LR)?
- Keyness (LL) prioritizes features that are most statistically distinctive between groups.
- Effect Size (LR) prioritizes features with the largest proportional differences between groups.
In practice, LL helps identify the strongest evidence for a difference, while LR helps you judge how large that difference is.
| Tag | LL | LR | RF (G3) | RF (G0) |
|---|---|---|---|---|
| AcademicTerms | 414.32 | 0.24 | 9.55 | 8.07 |
| Citation | 372.84 | 0.64 | 1.36 | 0.87 |
| InformationTopics | 82.68 | 0.17 | 3.65 | 3.23 |
| MetadiscourseInteractive | 73.24 | 0.45 | 0.52 | 0.38 |
| Inquiry | 48.14 | 0.27 | 0.89 | 0.74 |
| AcademicWritingMoves | 31.82 | 0.28 | 0.56 | 0.46 |
| Future | 16.36 | 0.18 | 0.68 | 0.60 |
All results are significant at p < 0.01 (LL threshold). RF values are percentages of DocuScope-tagged tokens. For a corpus of this size, the app restricts the comparison threshold to p < 0.01.
Switch to the Keyness Plot tab for a visual summary:
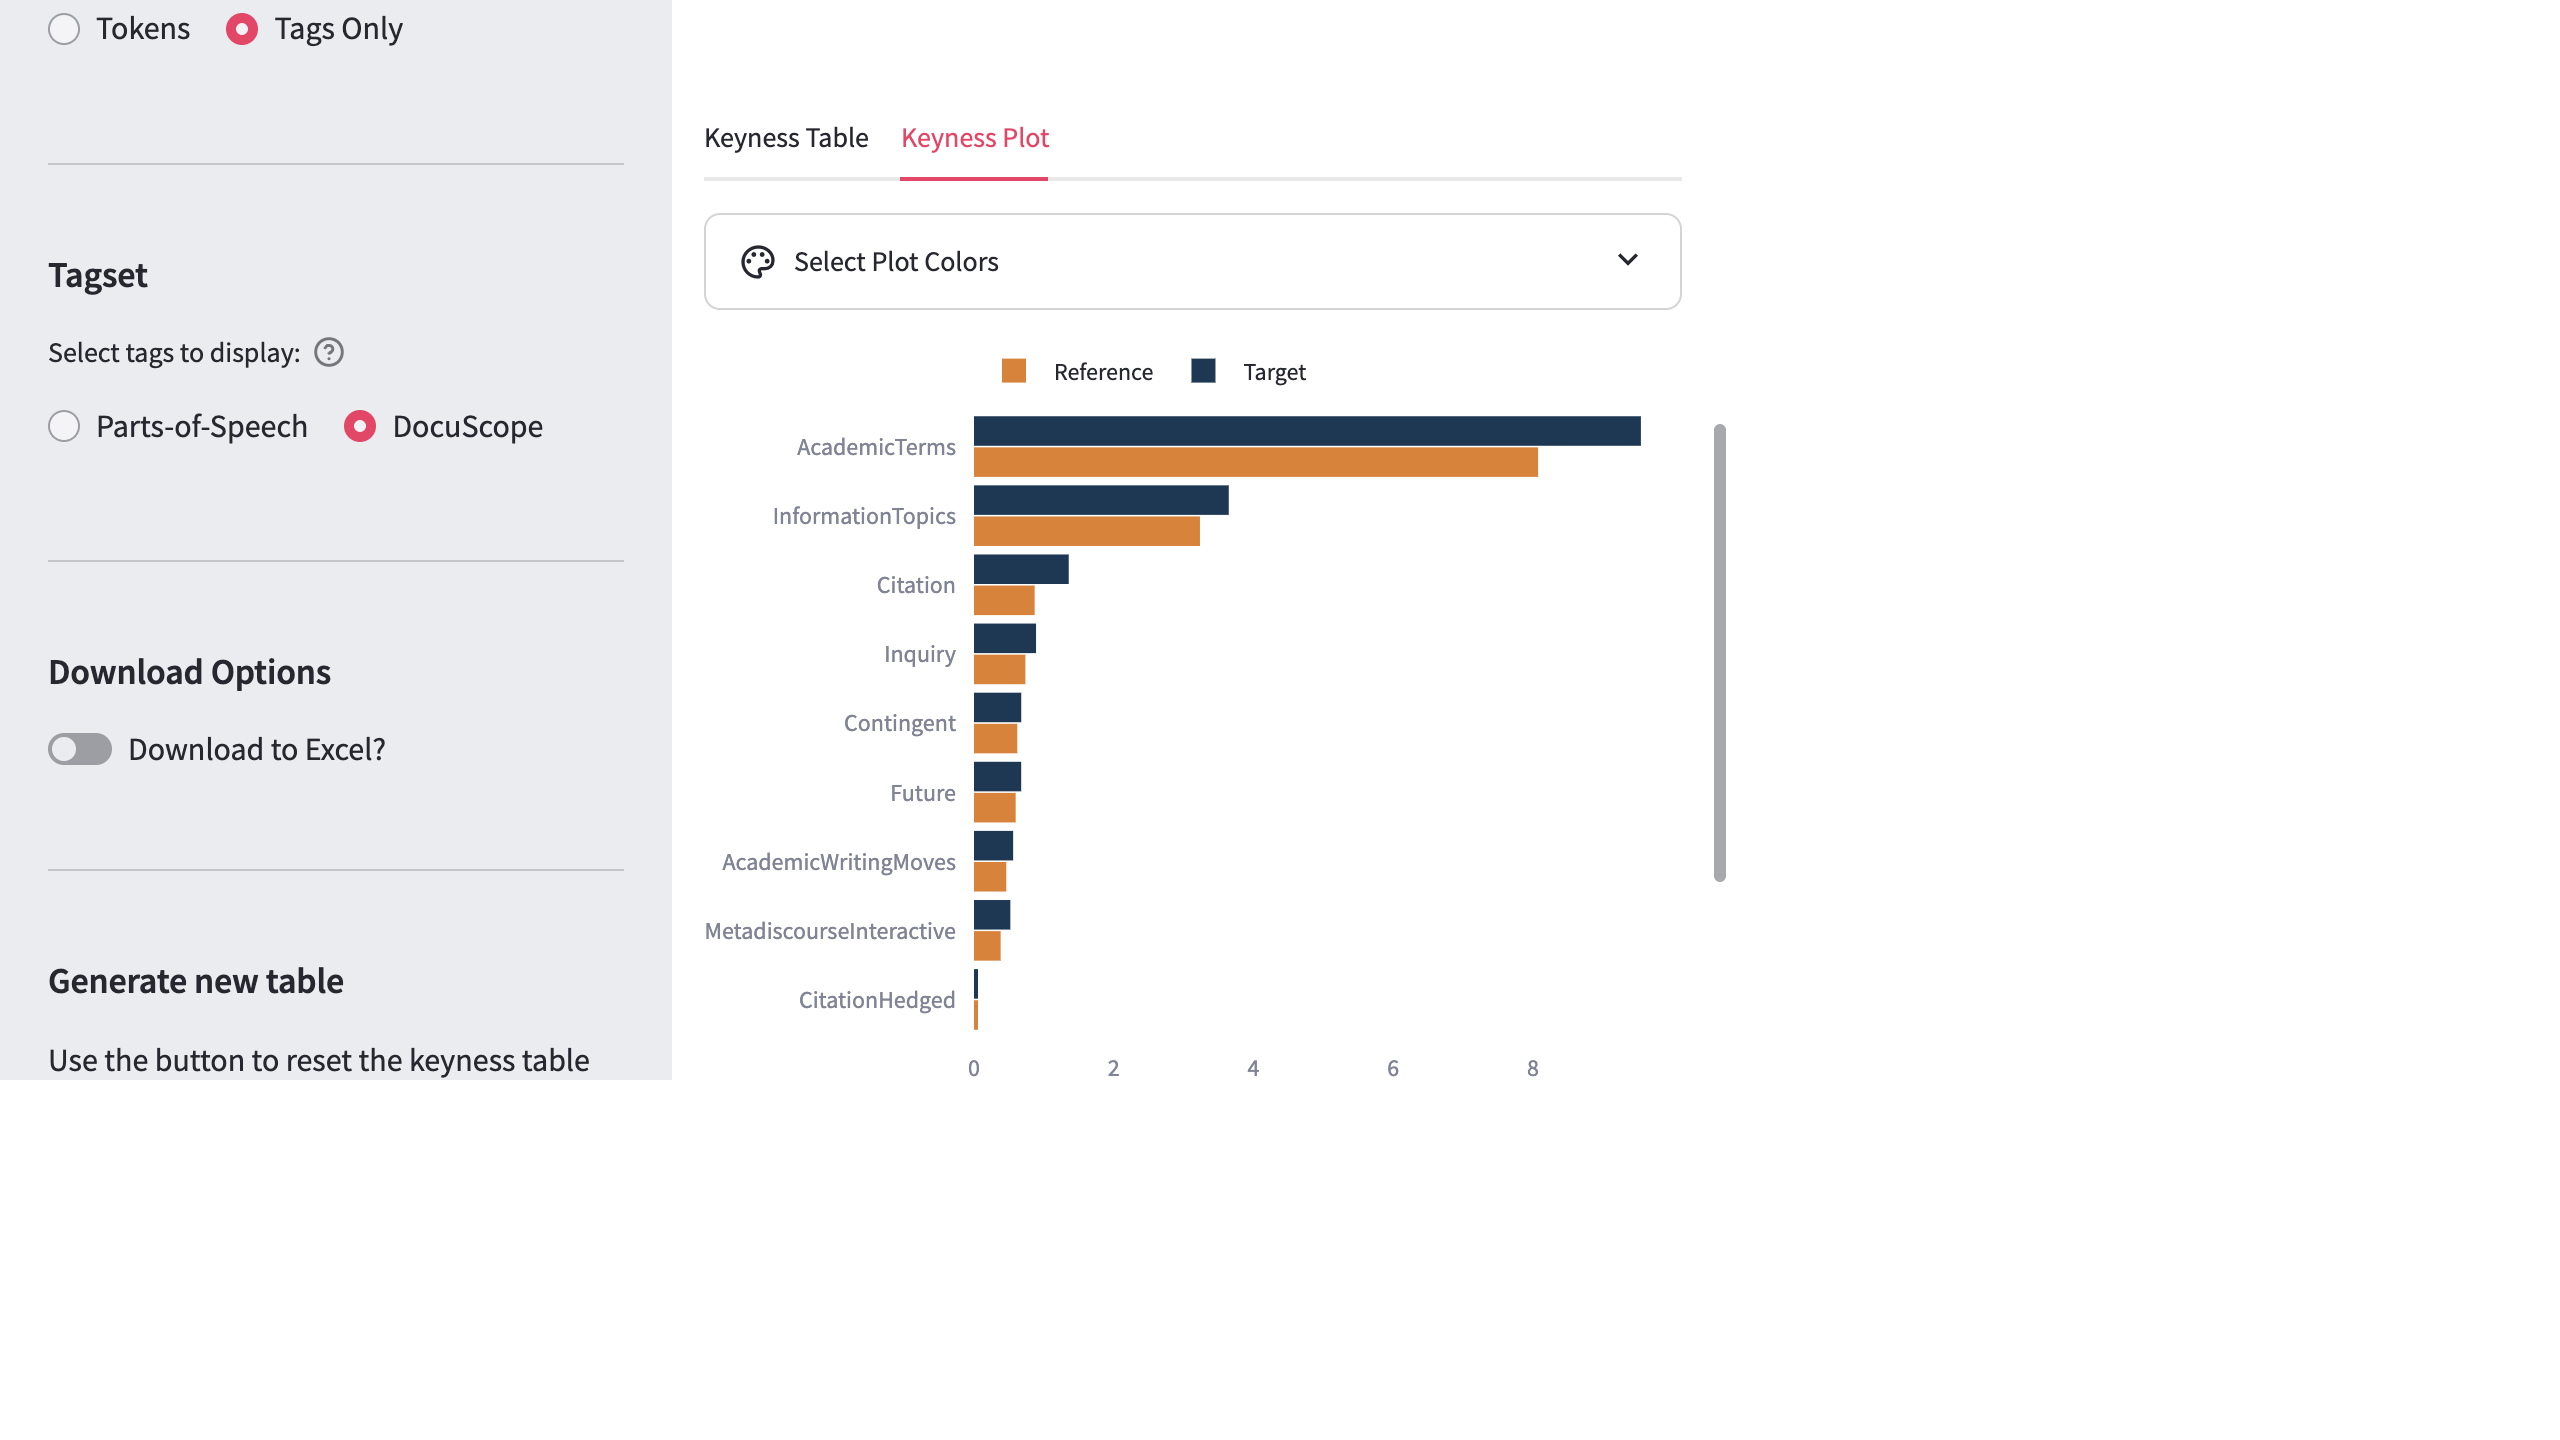
Interpretation: Third year graduate writers show significantly higher use of AcademicTerms (LL=414, LR=0.24) and Citation (LL=373, LR=0.64) relative to final-year undergraduates. The Citation effect is particularly informative: a log ratio of 0.64 represents a 55% increase in citation-related language, indicating that the most advanced students engage more extensively with scholarly sources. MetadiscourseInteractive (language that guides readers, e.g., this paper argues, as we have shown) is also significantly more prominent in G3, suggesting a more explicitly disciplined organizational style.
You can reverse the comparison — setting G0 as target and G3 as reference — to find which tags are more characteristic of undergraduate writing. Click Compare New Categories in the sidebar to reset.
1.7 Step 5: Advanced Plotting
Navigate to the Advanced Plotting page for multivariate visualizations.
Keyness compares one feature at a time. PCA answers a different question: whether documents cluster, overlap, or separate when you consider the full pattern of tag frequencies at once.
That makes PCA useful for seeing whether academic levels form broader rhetorical groupings, even when no single tag tells the whole story.
1.7.1 PCA: Visualizing the Full Tag Space
Select PCA from the plot type options. In the sidebar, select the DocuScope tagset, then click Generate PCA.
The scatterplot shows each document’s position in the two-dimensional PCA space. PC1 explains 11.30% of variance and PC2 explains 8.84% — modest but meaningful given the large number of DocuScope dimensions. Use the Highlight categories dropdown to select G0, G1, G2, and G3, which will color-code the documents by academic level.
Highlighting categories does not change the PCA calculation itself. It simply makes selected groups easier to see within the same shared space, helping you judge whether levels cluster, overlap, or spread differently across the major rhetorical dimensions.
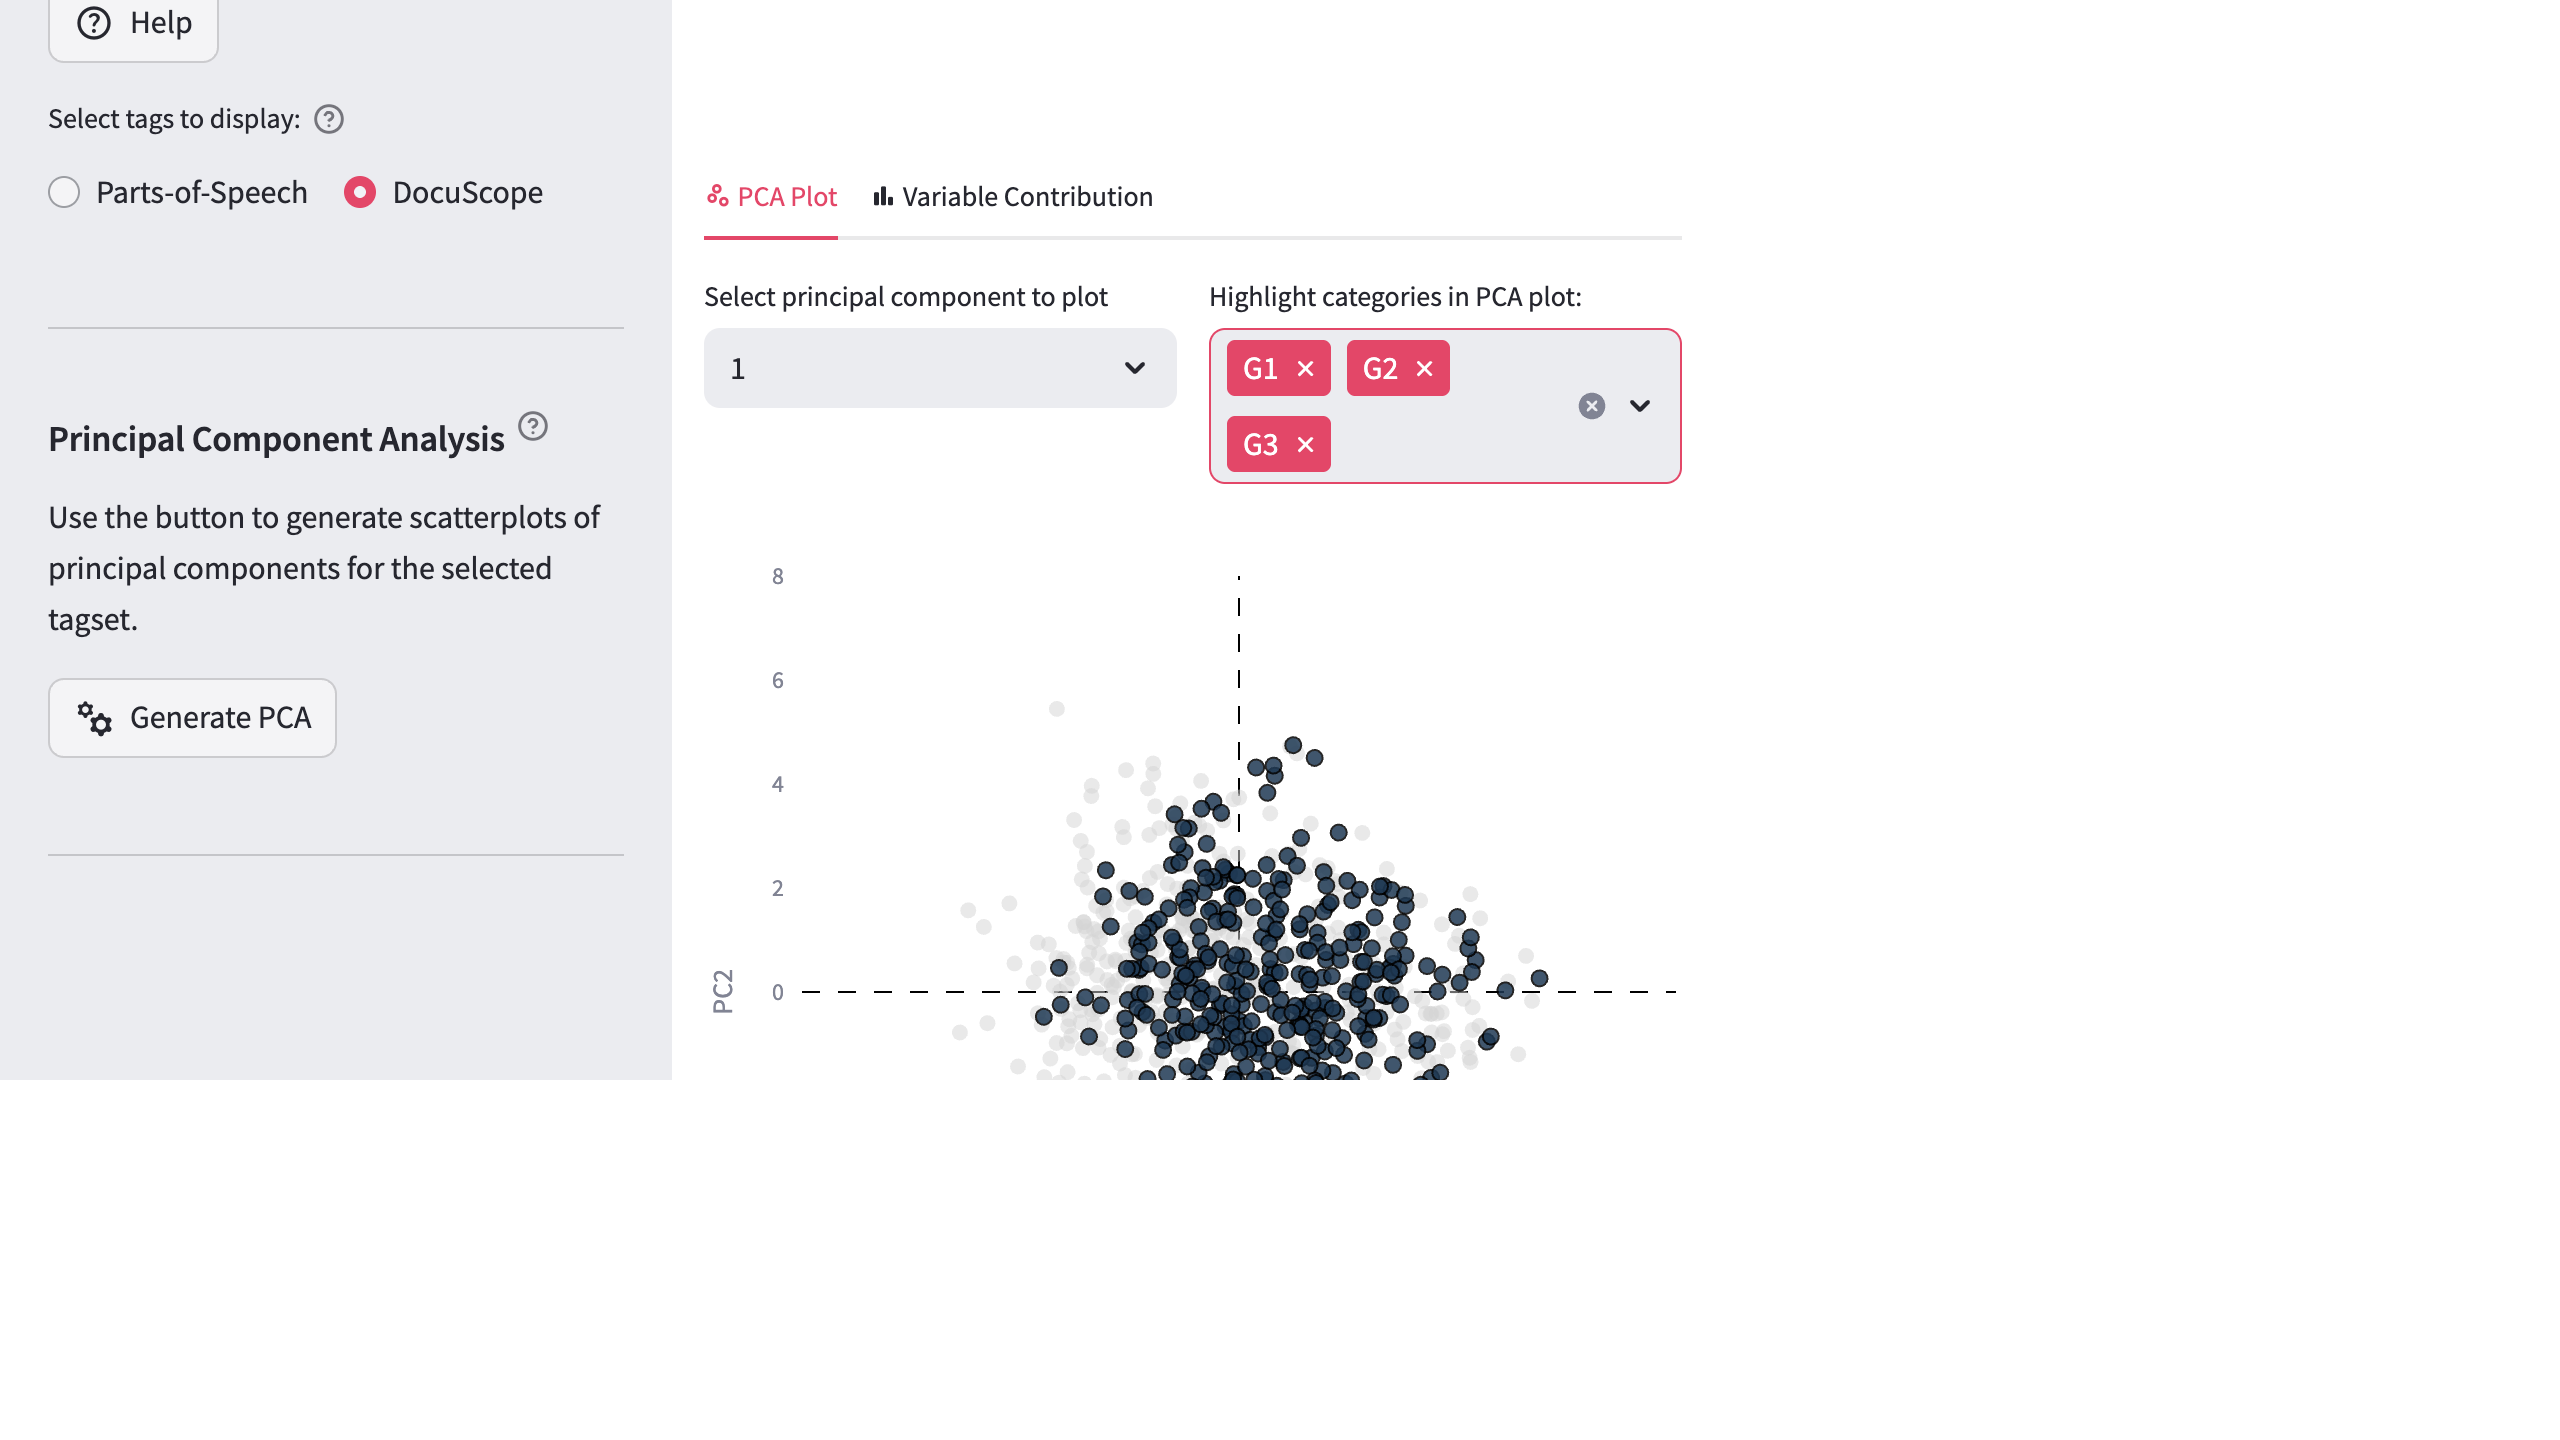
The substantial overlap between groups in PCA space reflects the diversity of disciplines and genres within each level — MICUSP includes papers from natural sciences, humanities, and social sciences, which vary in their rhetorical profiles. This underscores an important principle: aggregate level effects may be modest, but specific disciplinary or genre comparisons often yield stronger patterns.
1.7.2 Boxplots: Tag-Level Distributions by Group
PCA gives you a high-level view of the corpus as a whole. Boxplots let you zoom back in on one feature at a time, so you can see whether a difference such as AcademicTerms is consistent across documents or driven by a smaller number of outliers.
Select Boxplot from the plot type options. In the sidebar, choose the DocuScope tagset and enable Plot using grouping variables. Then select AcademicTerms, assign the academic levels to the grouping controls, and click Generate Boxplots. The boxplot will reveal not just mean differences but also the spread and outlier patterns within each level or grouping.
The Variable Contribution tab within the PCA view shows which DocuScope tags load most strongly on each principal component. This is useful for interpreting what PC1 and PC2 represent rhetorically.
1.8 Interpretation and Discussion
This workflow illustrates a core DocuScope CA capability: moving from corpus-level tag frequencies to targeted keyness comparisons to multivariate visualization, all within a single session.
Key findings from this analysis:
Academic language intensifies with level. AcademicTerms is the strongest differentiator between G3 and G0, with a significant increase in technical and disciplinary vocabulary as students advance.
Citation practices shift markedly. The 55% increase in Citation language for G3 writers (log ratio = 0.64) reflects the more extensive engagement with the scholarly literature expected at advanced graduate levels.
Interactive metadiscourse grows. G3 writers use more MetadiscourseInteractive features — language that explicitly guides readers through the text — consistent with increased awareness of academic writing conventions.
Within-level variation is substantial. PCA shows considerable overlap across groups, reflecting the multidisciplinary nature of MICUSP. Researchers interested in discipline-specific developmental trajectories would benefit from filtering to specific departments before comparing levels.
These patterns are consistent with research in writing development showing that graduate education produces systematic changes in rhetorical register — particularly increased use of academic terminology and more elaborate citation and metadiscourse practices (Aull 2023).
1.9 Next Steps
- Use KWIC (Key Words in Context) to examine specific instances of AcademicTerms or Citation in G0 vs G3 texts and build qualitative interpretations.
- Compare by discipline within a single level (see the Elsevier STEM vs. Humanities workflow for a similar approach using the Elsevier corpus).
- Export results with Download Corpus Data or Download Tagged Files for use in your own statistical software or qualitative analysis.