from google_ngrams import google_ngramGet started
The google_ngram function supports different varieties of English (e.g., British, American) and allows aggregation by year or decade. The package also supports the analysis of time series data using TimeSeries.
Fetching data
First we will import the functions:
Then, we can fetch, for example, x-ray by year in American English:
xray_year = google_ngram(word_forms = ["x-ray"], variety = "us", by = "year")xray_year.head()
shape: (5, 4)
| AF | Token | Year | RF |
|---|---|---|---|
| i64 | list[str] | i32 | f64 |
| 0 | ["x - ray"] | 1500 | 0.0 |
| 0 | ["x - ray"] | 1501 | 0.0 |
| 0 | ["x - ray"] | 1502 | 0.0 |
| 0 | ["x - ray"] | 1503 | 0.0 |
| 0 | ["x - ray"] | 1504 | 0.0 |
Alternatively, the following would return counts of the combined forms x-ray and x-rays in British English by decade:
xray_decade = google_ngram(word_forms = ["x-ray", "x-rays"], variety = "gb", by = "decade")xray_decade.head()
shape: (5, 4)
| Token | AF | RF | Decade |
|---|---|---|---|
| list[str] | i64 | f64 | i32 |
| ["x - ray", "x - rays"] | 0 | 0.0 | 1520 |
| ["x - ray", "x - rays"] | 0 | 0.0 | 1530 |
| ["x - ray", "x - rays"] | 0 | 0.0 | 1540 |
| ["x - ray", "x - rays"] | 0 | 0.0 | 1550 |
| ["x - ray", "x - rays"] | 0 | 0.0 | 1560 |
Analyzing data
To analyze data, import TimeSeries:
from google_ngrams import TimeSeriesTo use TimeSeries, provide a polars DataFrame, a column that identifies the time sequence and a values column that identifies the frequency varieble:
xray_ts = TimeSeries(time_series=xray_decade, time_col='Decade', values_col='RF')We can now generate visualizations like a barplot of frequencies by decade:
xray_ts.timeviz_barplot(dpi=100, width=9);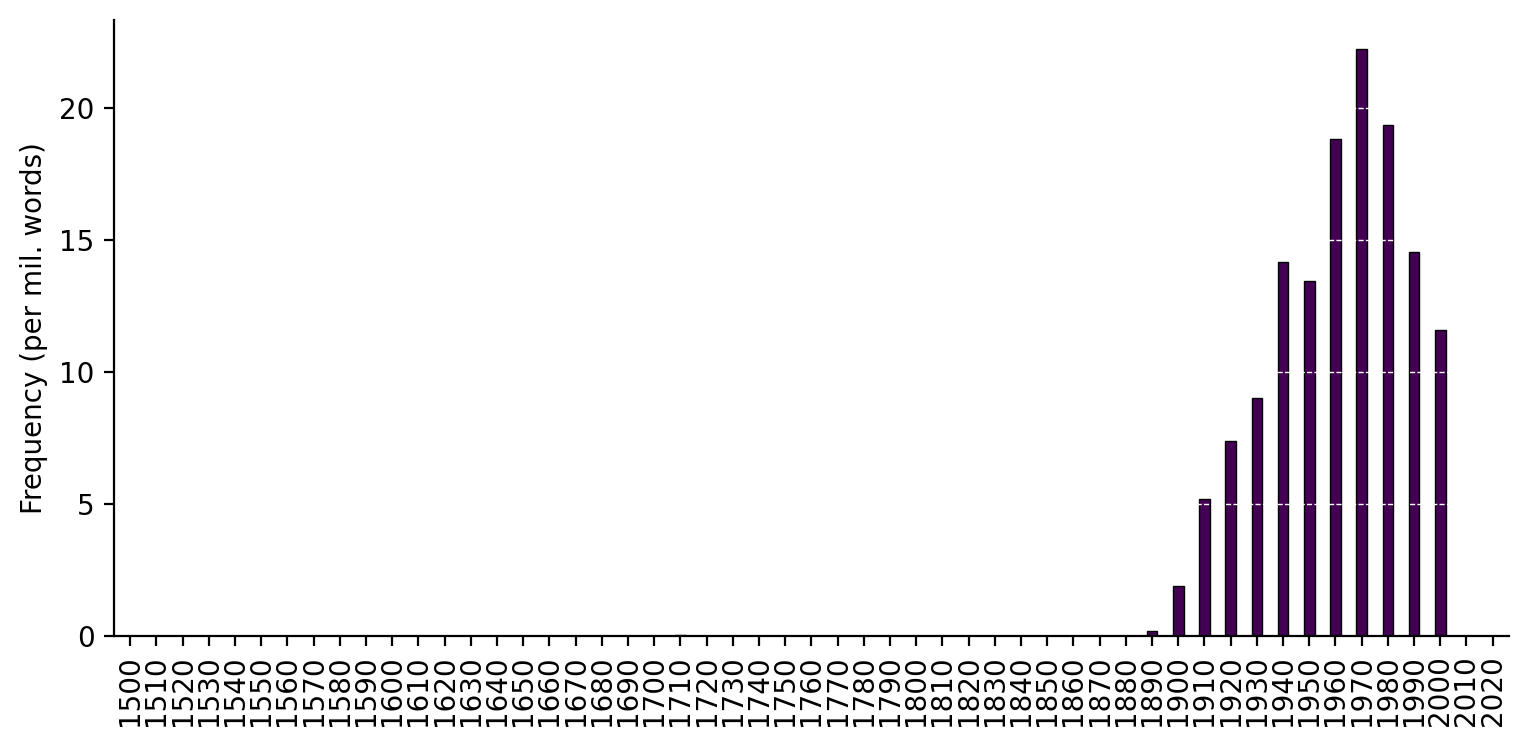
Filter data before VNC clustering
Note that the frequencies in this example are 0 or near 0 until the turn of the twentieth century.
Vizualizing VNC clustering can be made clearer by filtering out extended periods with no data. Thus, plots like this bar plot (or a similar scatterplot for by-year data) can be combined to effectively describe trajectories of change and periodization.
Filter the data
import polars as pl

xray_filtered = xray_decade.filter(pl.col("Decade") >= 1900)
Now, instatiate the TimeSeries on the filtered data.
xray_filtered_ts = TimeSeries(time_series=xray_filtered, time_col='Decade', values_col='RF')And create a VNC dendrogram.
xray_filtered_ts.timeviz_vnc();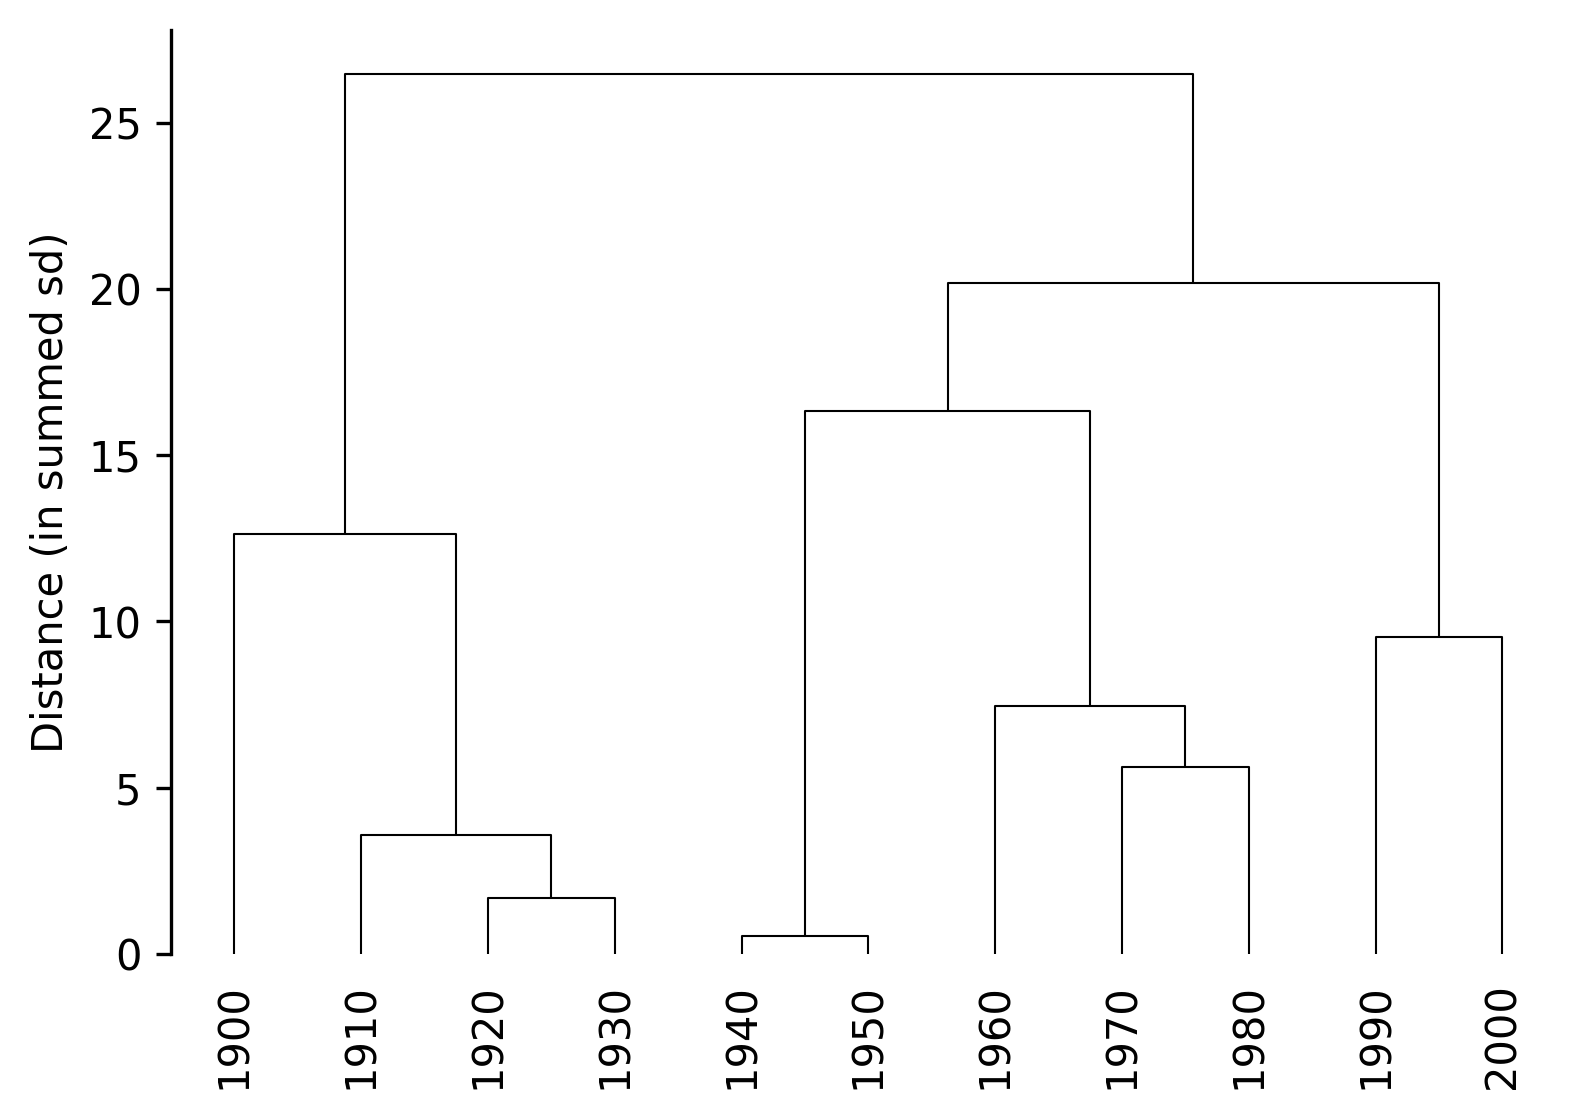
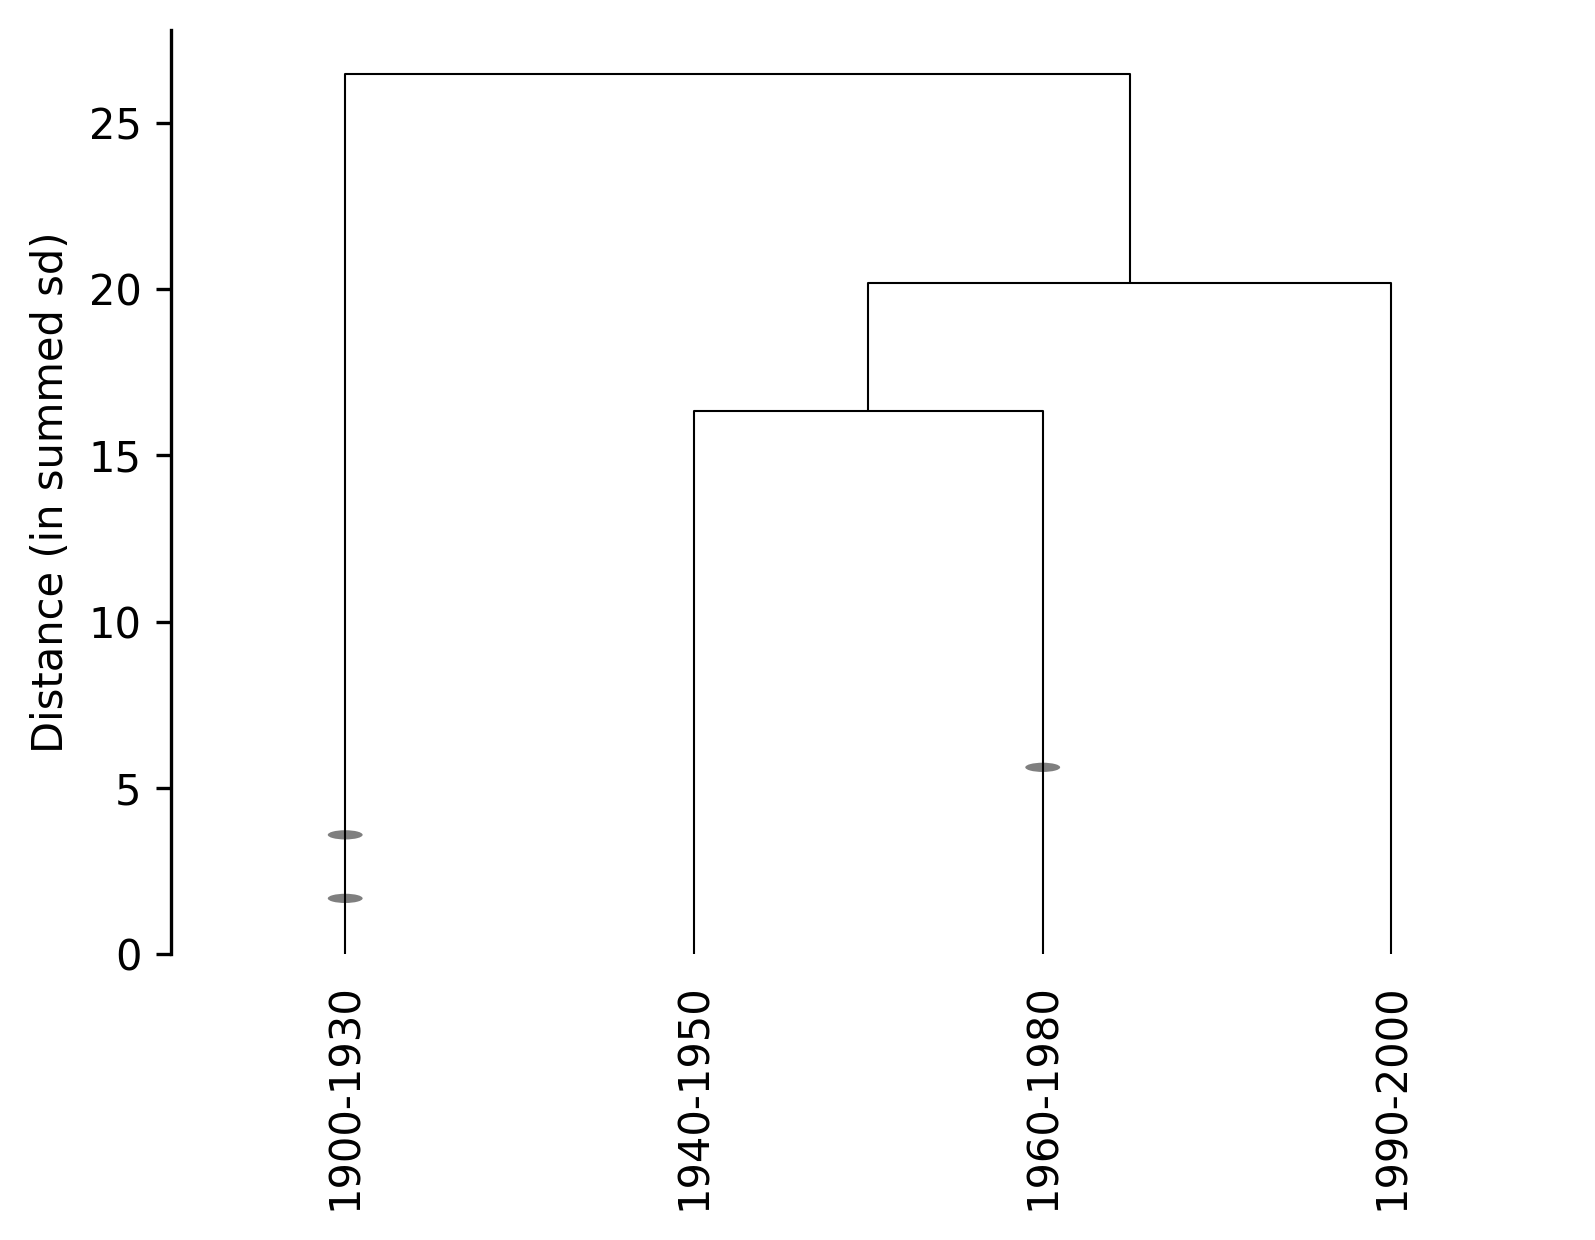
Dendgrams can also be contracted using the periodize=True option and designating a number of periods.
xray_filtered_ts.timeviz_vnc(periodize=True, n_periods=4);