| token | col_freq | total_freq | MI_1 |
|---|---|---|---|
Collocations
Introduction to association measures
Alex Reinhart 
Statistics & Data Science 36-468/668
David Brown
Dept. of English
Fall 2025
Collocations fundamentals
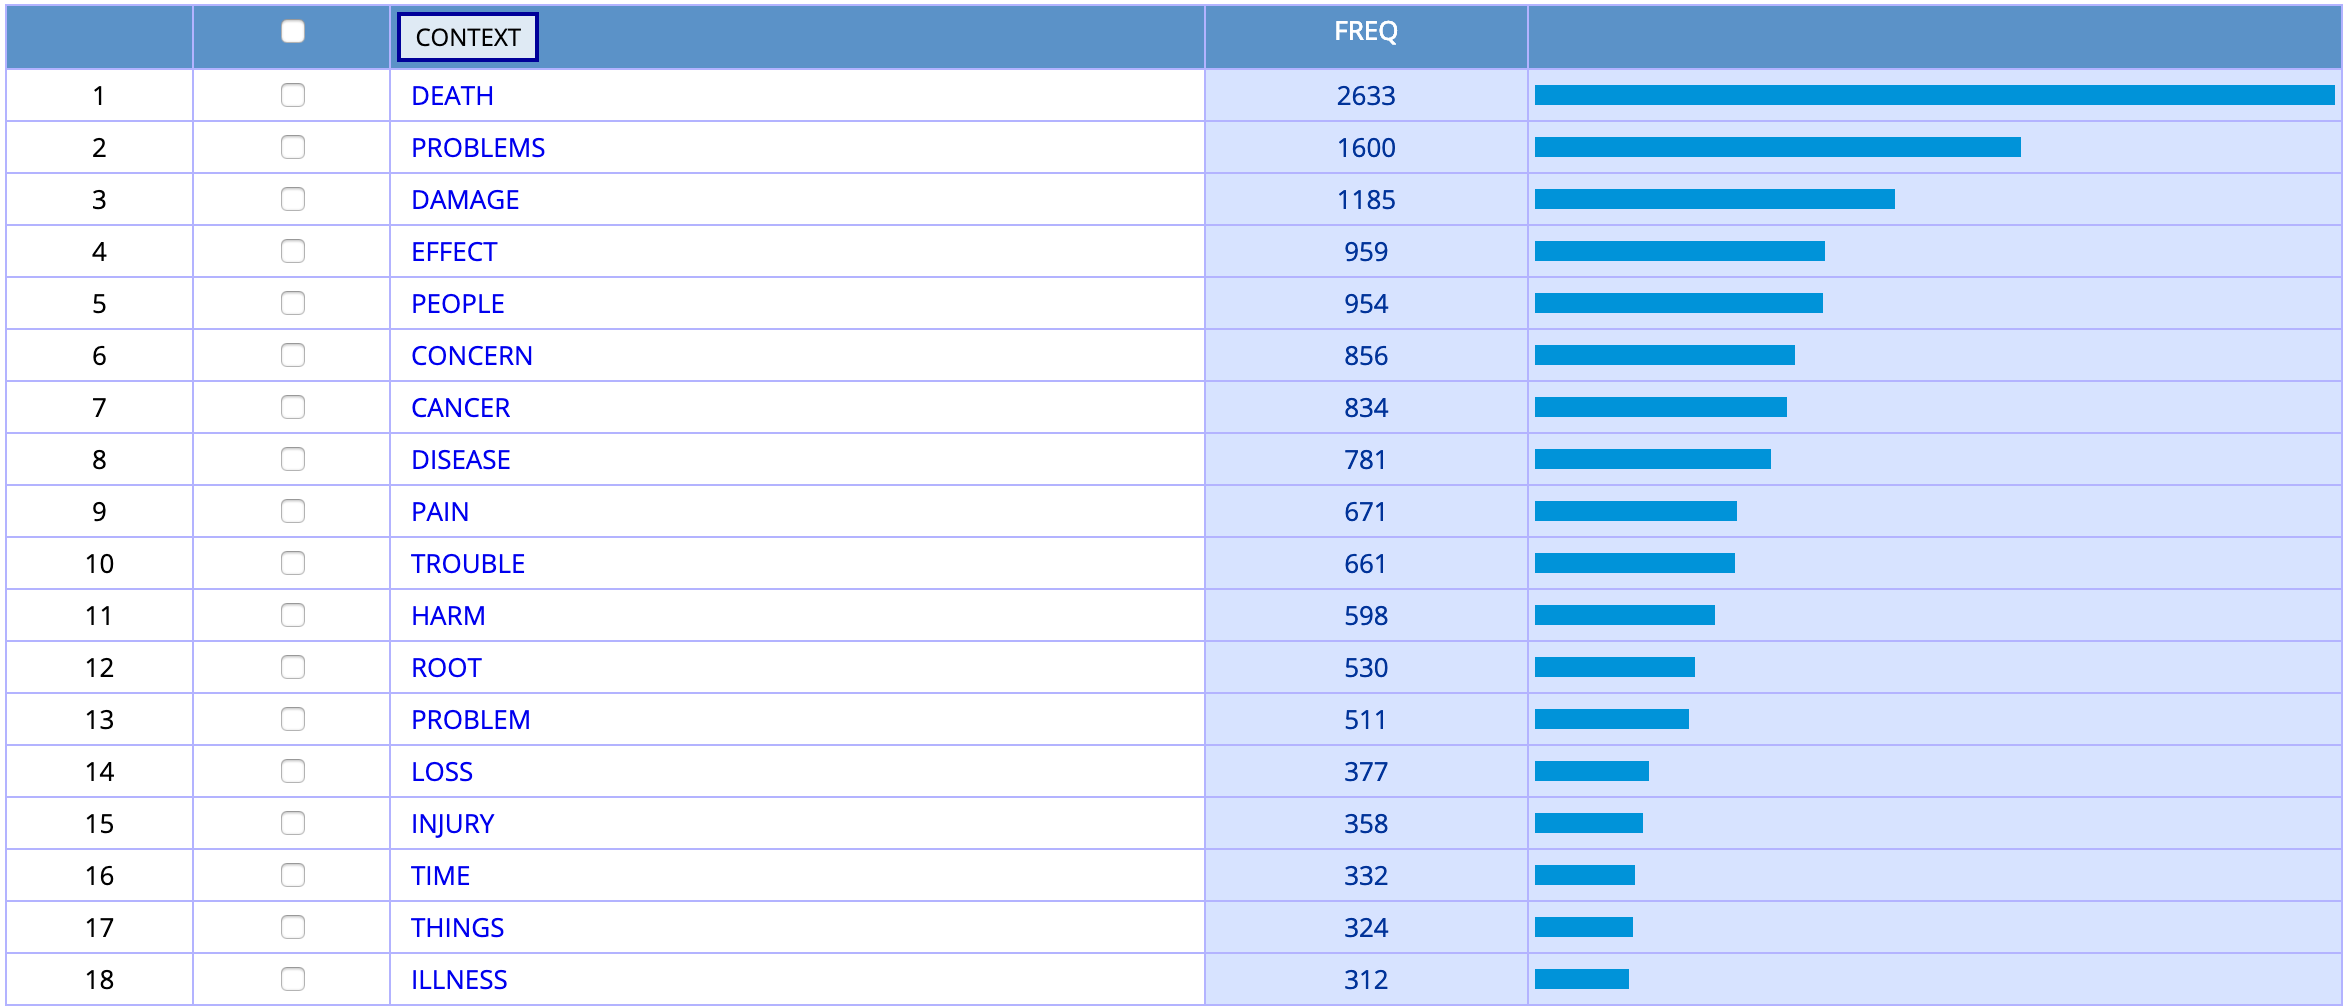
- Using COCA, we can quickly replicate an experiment first conducted by Stubbs (1995) in which he looked at the nouns that collocate with cause.

Collocations fundamentals
Question
What pattern (or patterns) do you recognize?
Collocations fundamentals
Question
What statistical problems do you see with using simple frequencies as a measure?
Association measures
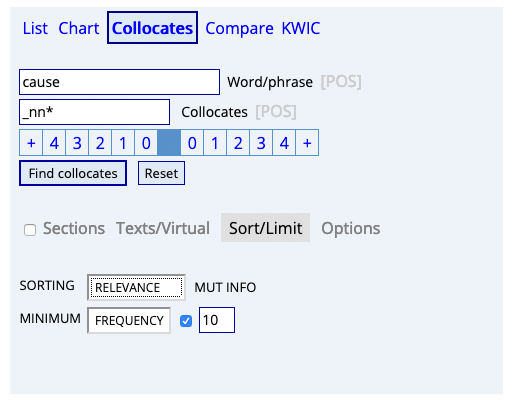
- Pointwise mutual information (PMI) (Church and Hanks 1990). See Brezina, chapter 3.

Association measures
- COCA allows for PMI calculations using the RELEVANCE option.
A collocational network
- From the tables, we can generate a collocational network that resembles what Brezina et al. (2015) propose.

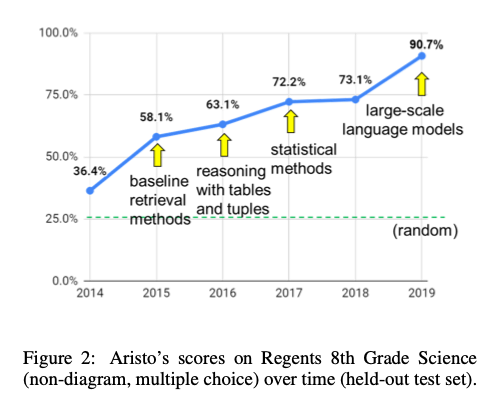
An example of an application
- A research group used PMI to create a model that answers standardized test questions (Clark et al. 2020).

An example of an application
- A research group used PMI to create a model that answers standardized test questions (Clark et al. 2020).

A collocational network
- Their model performed well (Clark et al. 2020).